At RideIn we are keen that cyclists are aware of the dangers and take all the proper safety precautions before heading out on the road. But there is also a lot of scaremongering putting the dangers of cycling out of perspective and crucially deterring people from getting on their bikes like we reported here in this cycle safety article.
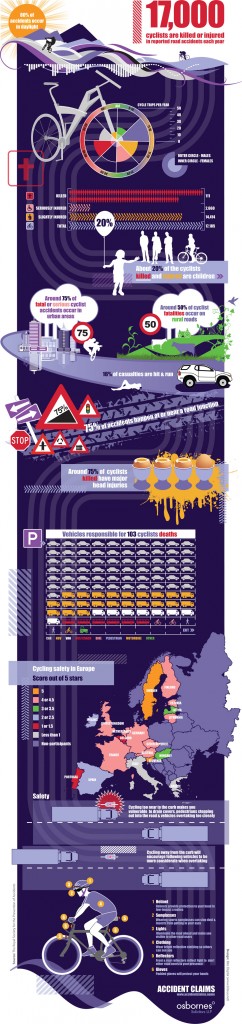
With the following infographic commissioned by Osbournes Ltd they have clearly decided to lead on the shock factor leading with the figure ‘17,000 killed or injured every year.’ I wonder what injuries make up that figure? Sore toes? Sprained thumb?
Some really interesting statistics around the number of fatalities on rural roads and the safest places statistically to ride a bike. The advice on road position contained within the infographic is also one of many cycling behaviors we encourage and is also on our list of cycling safety tips. People should be aware of these dangers and take heed of the safety advice but understand that it is all relative and the ‘danger’ of never getting on a bike could be far greater!
